The Nasdaq 100 rebounds from March lows and consolidates near highs, amid a cautious Fed, AI-driven growth, and constructive

Nasdaq 100: Solid but Not Euphoric Rally
The Nasdaq 100 rebounds from March lows and consolidates near highs, amid a cautious Fed, AI-driven growth, and constructive technical signals.
In mid-April 2026, the Nasdaq 100 confirms it is in an advanced recovery phase from its March lows, with prices rising from the 23,000–24,000 range to above 26,600 points. The long-term trend remains upward, while the trading range has gradually shifted higher: from an initial consolidation between 23,700 and 24,500 points, the index moved to a stable break above 25,000, extending toward 26,000–26,700 amid improving global risk sentiment and easing geopolitical tensions.
Monetary policy and impact on valuations
On the macroeconomic front, the Federal Reserve maintains a cautious stance. Following the rate cuts of 2025, interest rates remain anchored in the 3.50%–3.75% range, as confirmed by the FOMC meeting on March 18, 2026. The policy message remains strongly data-dependent: inflation, wage dynamics, and economic resilience guide expectations, with only a limited number of cuts projected for the year.
This environment continues to directly influence the growth sector: technology valuations remain sensitive to any revision in terminal rate expectations, making the Nasdaq 100 particularly reactive to macro news flow.
Structural drivers and latent fragilities
Despite positive real rates, long-term themes—artificial intelligence, cloud computing, and digitalization—continue to support demand for high-growth stocks. However, the concentration of returns in a handful of large-cap names and a still-elevated risk premium expose the index to sudden sector rotations and exogenous shocks.
Trading sessions between late March and mid-April highlighted intraday volatility spikes linked to both geopolitical developments and U.S. inflation data, signaling a market that remains highly sensitive and reactive.
Technical analysis: improving structure
From a technical perspective, the rebound has been significant: from lows in the 22,900–23,200 range in late March, the index climbed above 24,000, consolidating between 24,000 and 24,500 before breaking the 25,000 threshold and accelerating to 26,672 on April 17, near historical highs.
The 50-day moving average is turning upward again, positioned between 25,500 and 26,000, just below current price levels, while the 200-day average remains firmly upward sloping and well below prices, confirming a healthy long-term structure.
A linear regression over recent months shows a return to a slightly positive slope, with prices trading in the mid-to-upper portion of the channel: dynamic resistance lies in the 26,500–26,800 range, while support is found between 24,000 and 24,500. The current positioning suggests a higher likelihood of short-term mean reversion rather than an immediate extended breakout.
Momentum and price action
Momentum indicators confirm a balanced setup: RSI fluctuates between 50 and 60, with peaks around 65 during upward acceleration, without prolonged overbought conditions. The market appears strong but not overstretched.
Price action shows a sequence of higher lows and extended highs, with daily candles often closing in the upper part of their range. Near recent highs, upper shadows and shooting star-like patterns indicate profit-taking, while support zones display hammer-like formations, signaling buying interest on dips.
Key levels
Primary support: 24,000–24,200
Critical support: 23,700–23,900
Intermediate support: 25,000
Main resistance: 26,500–26,800
Only a sustained breakout above 26,800 would open the door to new all-time highs.
Algorithmic trading: operational example
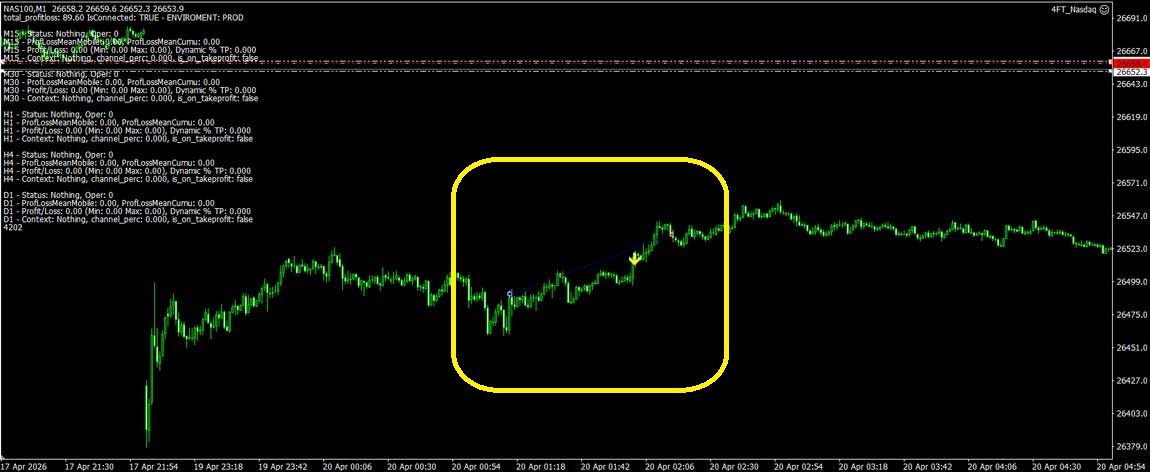
The image shows a practical example of a multi-timeframe Nasdaq strategy: an algorithmic system identifies an accumulation phase followed by a breakout, drawing a dynamic trendline and generating an entry signal (yellow arrow) as momentum resumes. The trade develops along a structure of higher lows, consistent with short-term trend-following logic.
From a technical standpoint:
Entry on micro-resistance breakout
Confirmation via rising structure
Automated risk management
No discretionary intervention
In a complex yet structurally bullish market environment, trading can be managed entirely automatically thanks to 4FT Invest’s algorithmic strategies, available on Metatrader 4 and 5 platforms.
Key services include:
Automated trading strategies on indices, forex, and other assets
Setup and configuration on MT4/MT5
Dedicated VPS for continuous 24/7 operation
Strategy updates and optimization
Ongoing technical support and assistance
Performance monitoring
This approach enables traders to capitalize on market opportunities while reducing emotional bias and ensuring disciplined execution.
Disclaimer: This content is for informational purposes only and does not constitute financial advice. Trading involves risk and may result in loss of capital.
© 4FT Invest LTD. All rights reserved