TradingView and 4FT Invest: Integrated Technical Analys
The 4FT Invest platform integrates TradingView charts to analyze all available assets in real time.
Introduction
Forex
23/10/2025
4FT News
TradingView and 4FT Invest: Integrated and Advanced Technical Analysis
The 4FT Invest platform integrates TradingView charts to analyze all available assets in real time.
Introduction
The 4FT platform (legal name: 4FT LTD) was created from the meeting of technological expertise and a passion for financial markets. 4FT has integrated TradingView technology into its operational “suite,” allowing users to access the advanced charts and technical tools developed by TradingView directly from the platform.
Below, we’ll first examine the main features of TradingView (as described on the official site) and then how these have been incorporated into 4FT Invest — including which assets can be analyzed, what tools are available, and what operational advantages result from this integration.
Features of the TradingView Platform TradingView — Track All Markets
TradingView is a global charting and social analysis platform for traders and investors, offering a wide range of technical tools, market data, and visualizations.
Main features and technical characteristics:
Data Coverage & Markets
- TradingView connects with over 3.5 million financial instruments (stocks, futures, forex, cryptocurrencies) from 100+ exchanges and 50+ brokers/crypto exchanges.
- This broad coverage enables multi-market chart analysis across diverse asset classes.
Chart Types and Resolutions
- Supports numerous chart types: bars, candles, hollow candles, lines, area, baseline, columns, high-low, etc.
- Some versions also support “special” types such as Renko, Kagi, Point & Figure, and Line Break.
- Offers resolutions down to seconds or ticks, and allows building bars from lower-resolution data.
Indicators, Drawing Tools, and Technical Features
- Hundreds of built-in indicators and drawing tools (trend lines, channels, shapes, levels, etc.) are available.
- Bar Replay function to historically review price evolution (“rewind market”).
- Compare multiple symbols on the same chart; use logarithmic or percentage scales; switch between units.
- Light/Dark themes and full multi-platform support (desktop, web, mobile).
Subscription Plans and Limits
- TradingView offers multiple plans (Essential, Plus, Premium, Ultimate), each with different limits on number of charts per tab, indicators per chart, data history depth, number of alerts, etc.
- Even the free version includes many features, though advanced traders may quickly encounter operational limits.
Broker / Data Integration
- TradingView provides APIs for broker and data-feed integration — allowing data and trading connectivity for brokers and providers to embed charts directly into their client interfaces.
- This means a broker, for instance, can offer TradingView charts directly within its own platform.
Thanks to these features, TradingView stands as one of the most complete platforms for technical market analysis, used by millions worldwide. Its range of tools, flexible charting, and broad data coverage enable deep, multi-asset analysis.
Integration of TradingView within the 4FT Invest Platform
Let’s now look at how 4FT Invest claims to have integrated TradingView and what this concretely means for platform users.
The integration with TradingView offers advanced technical analysis tools, allowing traders to operate with greater awareness and responsiveness. In practice, traders on 4FT can benefit from TradingView’s technical analysis features directly within their trading interface.
Operational Aspects of the Integration
Here’s how the integration is configured:
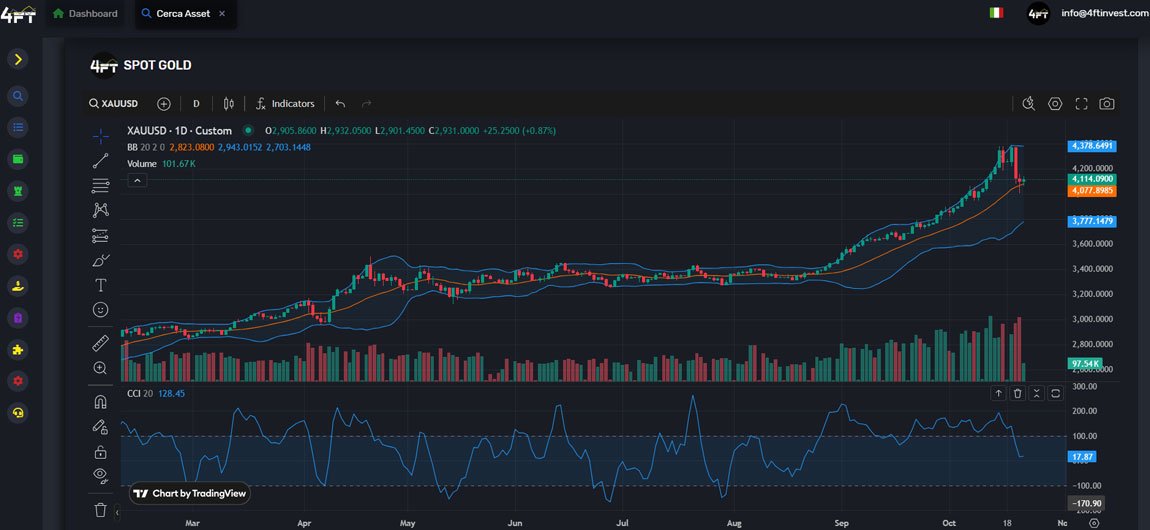
- Within the 4FT Invest interface, every tradable asset on the platform (CFD, forex pair, index, or cryptocurrency, depending on the broker’s catalog) is linked to an integrated TradingView chart. This means the user does not need to leave the platform or use external software — the advanced chart is already embedded in the 4FT Invest environment.
- The integration enables real-time price visualization, application of indicators and drawing tools, comparison between symbols, and in-depth technical analysis.
- Technically, the integration relies on TradingView Advanced Charts, which are embeddable front-end components for brokers/partners.
- For 4FT users, this translates into the ability to analyze all available assets with professional-grade charting tools without switching to third-party environments.
Concrete Benefits for Users
- Integrated Technical Analysis: No need for separate software or subscriptions; analysis is done directly within 4FT Invest using TradingView charts.
- Greater Awareness and Responsiveness: Advanced tools (indicators, drawings, comparisons) help users react faster to market movements.
- Unified Environment: Trading and chart analysis coexist in the same interface, minimizing app-switching, latency, and improving the user experience.
- Wide Asset Coverage: If 4FT offers many instruments, each can be analyzed with the same advanced charting capabilities.
Note: Even with advanced charting, trading decisions remain the user’s responsibility — integration does not eliminate market risk.
How to Use TradingView Charts on 4FT Invest
A practical, step-by-step guide to getting the most from the integrated functionality:
- Log in to the 4FT Invest platform.
- Select the desired asset in the “Search Asset” section (stock, forex, index, or cryptocurrency).
- Activate the integrated chart — this opens an advanced graphical interface (from TradingView) where you can choose timeframes, chart types (candlestick, area, line, etc.), and apply indicators or drawing tools.
- Customize the analysis:
- Choose the chart type (e.g., candlestick).
- Apply indicators (moving averages, RSI, MACD, etc.).
- Draw trend lines, channels, support/resistance levels.
- Compare symbols (e.g., base asset vs. benchmark).
- Change time resolution (1 minute, 5 minutes, daily, weekly).
- Interpret the signals — e.g., identify trend breaks, reversal patterns, divergences, etc.
- Save chart templates or layouts for future use.
Summary
Integrating TradingView’s charting technology into the 4FT Invest platform is a major technical strength: it gives platform traders access to advanced, flexible, and multi-market technical analysis tools without leaving the trading environment. From extensive data coverage to numerous indicators and customizable layouts, this ecosystem promotes greater market awareness and potentially faster reactions.
Of course, as with any tool, effectiveness depends on the user’s skill and ability to interpret signals and market contexts correctly. Nonetheless, from an infrastructure standpoint, 4FT Invest’s adoption of TradingView adds a professional-level analytical and graphical component to its platform.