Oro: scommessa per speculatori o bene rifugio?
Analisi tecnica ed approfondimenti su come evolverà il mercato dell'oro
Oro: scommessa per speculatori o bene rifugio?
Analisi tecnica ed approfondimenti su come evolverà il mercato dell'oro
Situazione attuale (2 settembre 2025)
Il prezzo dell'oro ha raggiunto nuovi massimi storici: i future hanno aperto intorno a 3.517,90 $/oncia, in rialzo dell'1,3 % rispetto alla chiusura di venerdì (3.473,70 $).
Secondo altre fonti, il prezzo spot ha superato i 3.500 $, toccando livelli mai visti.
Le quotazioni sui mercati MCX in India registrano un valore di ₹1.06.539 per 10 g, avvicinandosi alla soglia ipotetica di ₹1.20 lakh entro fine 2025.
Motivazioni del rally attuale
I principali fattori alla base della forte spinta dell’oro includono:
- Debolezza del dollaro e crescente sfiducia verso asset denominati USD;
- Aumento di acquisti da parte di banche centrali (India, Cina, Turchia, Polonia), in cerca di riserve più sicure;
- Aspettative diffuse di riduzione dei tassi da parte della Fed e altre banche centrali, in un contesto di incertezza economica globale;
- Instabilità geopolitica persistente (es. Ucraina), tendenza verso la de‑dollarizzazione, inflazione elevata;
- Attività elevate nei mercati dei futures: aumento del volume e dell’open interest sulla piattaforma COMEX, a testimonianza dell’interesse speculativo in espansione.
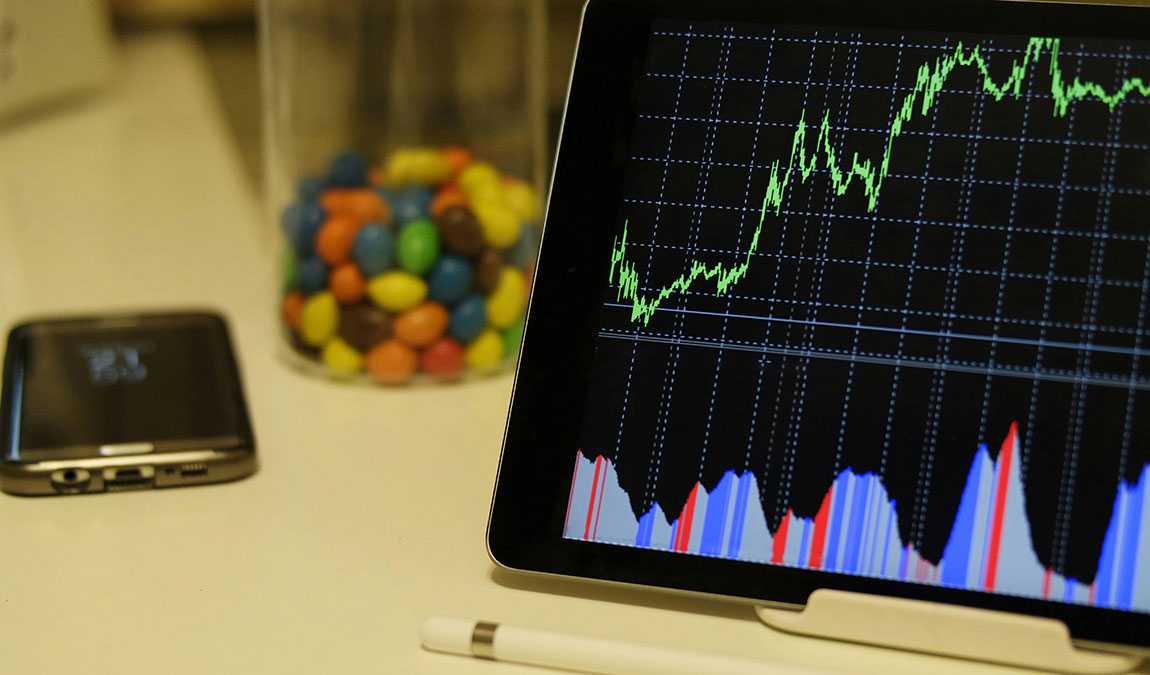
Analisi tecnica aggiornata (2 settembre 2025)
- EMA 20 e EMA 50
- L’EMA20 si trova a 3.393 $, ben al di sopra dell’EMA50 a 3.359 $.
- Questo differenziale conferma una solida tendenza rialzista di medio periodo, con il prezzo che si mantiene stabilmente sopra entrambe le medie mobili.
- La distanza crescente tra le due curve riflette la forza del trend, anche se inizia a emergere un segnale di possibile eccesso.
- Bande di Bollinger
- Considerando l’attuale quotazione sopra i 3.500 $, il prezzo si muove vicino (o oltre) la banda superiore.
- Questo è tipico di un mercato in forte accelerazione, ma anche di una possibile fase di “ipercomprato tecnico”. Potrebbe preludere a consolidamenti laterali o brevi ritracciamenti, piuttosto che a una prosecuzione lineare del rally.
- CCI (Commodity Channel Index)
- Il valore di 234, seppur molto sopra la soglia di +100, indica un momentum ancora fortemente positivo.
- Tuttavia, il fatto che il CCI sia in discesa segnala che l’intensità del trend rialzista potrebbe iniziare ad attenuarsi. In pratica: il mercato resta “tirato”, ma la pressione degli acquisti estremi si sta gradualmente riducendo.

Interpretazione complessiva
- La combinazione EMA20 > EMA50 mantiene attivo il segnale rialzista.
- L’avvicinamento alle bande di Bollinger superiori e il CCI in calo da livelli estremamente elevati suggeriscono che la fase di euforia potrebbe rallentare.
- Lo scenario più probabile nel breve è un consolidamento sopra i 3.450–3.480 $, con possibili test ai 3.550–3.600 $ se il momentum dovesse riprendere.
- Un’eventuale rottura decisa sotto i 3.450 $ indebolirebbe il segnale rialzista di breve, pur lasciando intatto il trend primario positivo.
Prospettive future
- Scenario rialzista: Goldman Sachs ritiene realistico un possibile arrivo dell’oro a 4.000 $ entro metà 2026.
- Scenario ribassista: Citi, invece, prevede che in caso di ripresa economica e riduzione dell’incertezza, i prezzi potrebbero scendere sotto i 3.000 $ entro fine 2025 o inizio 2026, con un target 6–12 mesi a 2.800 $.
Elementi chiave da monitorare:
- Politica monetaria: eventuali rialzi dei tassi contrari alla tendenza sicura dell’oro.
- Dollar strength: rinforzo del USD può pesare sull’oro.
- Stabilità geopolitica: una riduzione delle tensioni potrebbe ridurre la pressione sul metallo.
- Domanda delle banche centrali e degli ETF: flussi consistenti sostengono il prezzo.
In sintesi
L’oro oggi 2 settembre 2025 si trova in un territorio da record, sostenuto da spinte macroeconomiche, geopolitiche e di mercato.
Da un punto di vista tecnico, i segnali suggeriscono un forte momentum, ma anche potenziali segnali di ipercomprato e volatilità elevata.
Per lo speculatore, il trend offre opportunità interessanti nel breve, ma richiede attenzione ai segnali di inversione.
Per l’investitore in cerca di un bene rifugio, l’oro appare ancora molto attraente, anche se non immune da oscillazioni nei prossimi mesi.