Inflation, Iran and the Fed drove volatility: the next test is now resistance levels and central banks.

Nasdaq: June between shocks and rebound
Inflation, Iran and the Fed drove volatility: the next test is now resistance levels and central banks.
The first half of June 2026 delivered an apparently contradictory message for the Nasdaq: an almost flat overall performance, but very high volatility. The Nasdaq-100 closed on June 15 at 30,543.92 points, practically in line with its level at the beginning of the month, but only after moving within a range of more than 8% between its monthly high near 30,762 and its low around 28,197. The most relevant factor, therefore, is not just the final balance, but the way the market absorbed a series of macroeconomic, geopolitical and monetary shocks concentrated within just a few days.
The Nasdaq Composite closed June 15 at 26,683.94 points, with a daily gain of 3.1% and a year-to-date performance of around +14.8%. The mid-month rebound came after very difficult sessions, particularly the sharp decline on June 5 and the pressure seen between June 9 and 10. The subsequent recovery was mainly driven by technology, semiconductors and stocks linked to artificial intelligence.
The first major driver was inflation. The U.S. CPI for May showed a monthly increase of 0.5% and an annual rise of 4.2%, while core CPI climbed to 2.9% year-on-year. The energy component played a decisive role, with the energy index up 23.5% on an annual basis. The following day, the PPI reinforced the picture of price pressure: +1.1% month-on-month and +6.5% year-on-year for final demand. For the Nasdaq, an index highly sensitive to interest rates, this reopened the most delicate issue: how long the Federal Reserve will be able to maintain a restrictive stance.
The second driver was geopolitical. The crisis involving the United States, Israel and Iran, with tensions around the Strait of Hormuz, had initially fueled the risk of a global energy shock. Then, the announcement of a preliminary agreement between Washington and Tehran quickly changed market sentiment. Brent crude fell toward the $80-per-barrel area, while WTI moved below $79. For growth equities, this was a crucial development: less pressure on energy means a lower risk of further imported inflation and, consequently, a reduced probability of an even more aggressive Federal Reserve.
The third driver was sector-specific. Artificial intelligence and semiconductors continued to represent the core of the bullish narrative. The rebound in chip stocks supported the Nasdaq precisely at a time when the market was looking for confirmation on the resilience of future earnings. The quarterly rebalancing of the Nasdaq-100, effective from June 22, also strengthened the focus on high-growth companies: Astera Labs, CoreWeave, Nebius, Rocket Lab and Teradyne will enter the index, while Charter Communications, Cognizant, Insmed, Verisk Analytics and Zscaler will leave it. This is an important signal: the index remains increasingly oriented toward AI infrastructure, semiconductors, cloud and advanced technology.
On the macroeconomic front, the picture is not recessionary, but it remains complex. The U.S. labor market created 172,000 new jobs in May, with unemployment steady at 4.3%. The ISM manufacturing index rose to 54, its highest level since May 2022, with new orders increasing to 56.8 and prices still elevated at 82.1. The University of Michigan consumer sentiment index recovered to 48.9 from 44.8, but it remains historically low. In short: the economy continues to hold up, but inflation limits the room for maneuver available to central banks.
The middle week of June is therefore dominated by monetary policy. The Fed meets on June 16-17, with markets expecting the Fed Funds target range to remain unchanged at 3.50%-3.75%. The key point will not be the decision itself, but the language of the statement, the dot plot and the tone of the new Chair, Kevin Warsh. If the Fed confirms a cautious but not openly aggressive approach, the Nasdaq could maintain support from the AI rally. If, however, the message strongly reopens the risk of rate hikes before year-end, growth multiples could come under renewed pressure.
The Bank of England and the Swiss National Bank will also be closely monitored. The BoE will announce its decision on June 18, with the Bank Rate currently at 3.75% and expectations leaning toward no change, although a growing number of economists do not rule out a rate hike later in 2026. The SNB’s monetary policy assessment is also expected on June 18, with its policy rate at 0% and consensus pointing to stability. The SNB’s role is important above all for foreign exchange markets and demand for safe-haven assets, as the Swiss franc has absorbed part of the global inflationary shock.
The technical levels for the Nasdaq-100 are now very clear. The first resistance area is located around 30,540-30,670 points, where the market has already struggled to stabilize. Above this range, the real key level is 30,760-30,800, the high of the first half of June. A solid close above this threshold would open the way toward 31,000 and then 31,250 points.
On the downside, the first relevant support is located around 30,300-30,240. A break below this zone would make a return toward 29,700-29,600 likely. The next intermediate support stands near 29,220, the June 12 low, while the 28,500-28,200 area represents the true short-term dividing line. Below 28,200, the technical picture would turn clearly fragile again.
For the rest of June, the base-case scenario remains one of volatile consolidation with a moderately constructive bias, provided that three elements remain favorable: oil stable below the $85 area, a Fed no more aggressive than expected, and resilience in AI and semiconductor stocks. In that case, the Nasdaq could attempt a renewed attack on the monthly highs. The bullish scenario, however, requires a confirmed breakout above 30,800, supported by volumes and by a decline in bond yields. The negative scenario would be triggered by Brent returning above $90-95, a more hawkish Fed, or a daily close below 29,220.
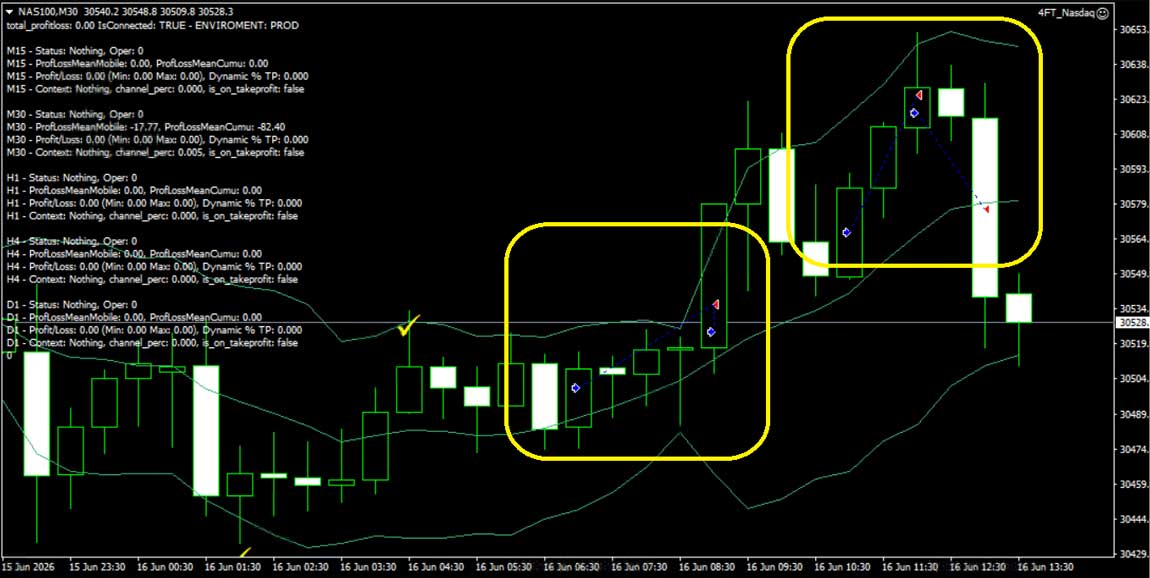
This is the context in which the MT4 trading activity observed on the NAS100 should be interpreted. The M30 chart shows a compression phase, followed by a clearly recognizable bullish breakout and a subsequent acceleration toward the upper part of the volatility channel. The most interesting aspect is not only the entry into the move, but the system’s ability to follow the swing without anticipating the exit unnecessarily. In the second phase, when price begins to show signs of exhaustion and moves back toward the channel mean, the strategy appears to have already been neutralized, with no open positions at the time of the screenshot.
This type of management highlights the value of algorithmic trading when it is built with professional criteria: it does not eliminate risk, but it reduces the emotional component, codifies entry and exit rules, and makes it possible to operate even in high-volatility environments such as the one seen on the Nasdaq in mid-June. From this perspective, the 4FTinvest platform moves precisely in this direction: not as a simple signal generator, but as an operational ecosystem that integrates technical analysis, macro context, automation and exposure control. In market phases driven by sudden news and violent repricing, this approach can make the difference between chasing price action and managing risk with method.
Disclaimer: this article is for informational purposes only and does not constitute financial advice, investment solicitation or an operational recommendation. Every trading decision involves risk and should be assessed according to one’s own profile, capital and time horizon.
© 4FT Invest LTD. All rights reserved