On March 3 the precious metal fell over 4% after the previous day's surge driven by geopolitical tensions
Gold Drops After Geopolitical Rally
On March 3 the precious metal fell over 4% after the previous day's surge driven by geopolitical tensions
The trading session of March 3 marked a sharp reversal for the gold market. After the strong rise recorded on March 2, fueled by geopolitical tensions and investors seeking safe-haven assets, the precious metal experienced a correction of more than 4%, quickly returning to lower levels.
Such a large move in such a short time frame may appear surprising, but it reflects a common market dynamic: when a strong momentum driven by fear or uncertainty emerges, it is often followed by profit-taking and a repositioning of market participants.
From Safe-Haven Rally to Profit Taking
The rally on March 2 was largely driven by typical dynamics seen during periods of geopolitical stress: increased uncertainty, capital flowing into safe-haven assets, and a rise in demand for gold as a hedge.
However, when the move becomes particularly rapid, institutional investors and speculative funds often move quickly to lock in profits. This profit-taking activity, combined with technical sell orders and the reduction of speculative positions, can trigger sharp downward accelerations.
Another important factor concerns the technical structure of the market. After a strong rally, gold was trading near the upper boundary of its volatility channel. In such conditions, even moderate selling pressure can trigger a broader retracement.
High Volatility and Technical Dynamics
The March 3 session clearly illustrates how, during periods of high volatility, price movements can become extremely rapid. Within hours the market can shift from a phase of bullish momentum to a technical correction, with wide intraday swings.
In these environments, understanding market swings becomes particularly important. Swings represent the natural oscillations of price within a broader trend and are a key element in interpreting market structure.
Algorithmic Trading and Swing Exploitation
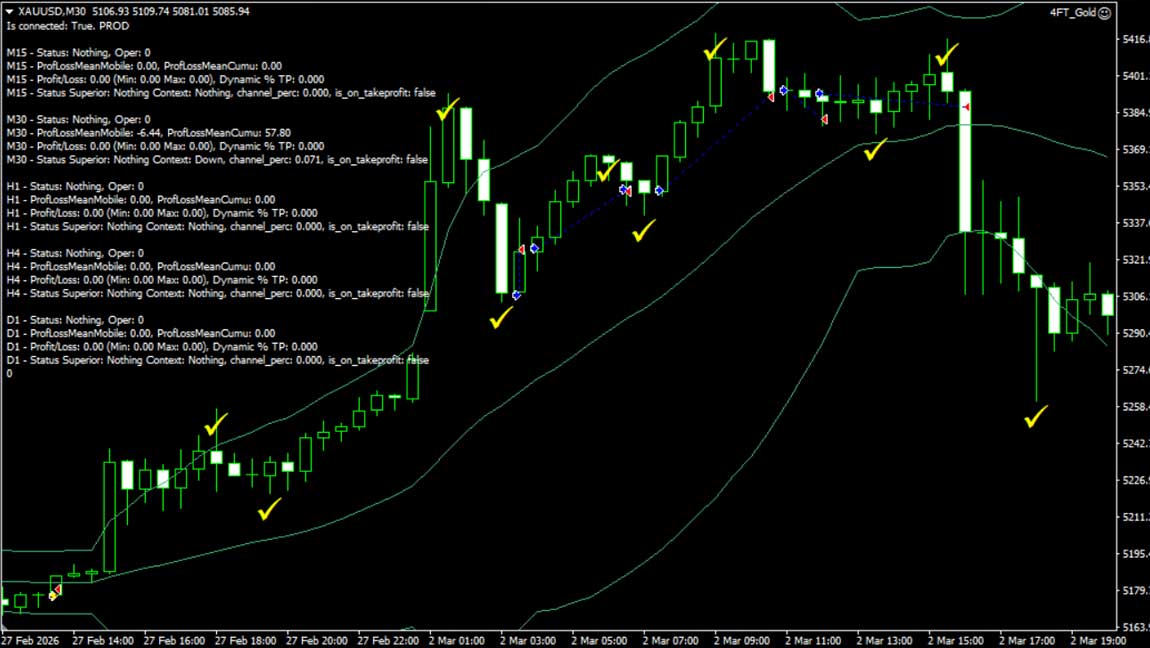
The trading activity shown in the chart highlights the application of an advanced algorithmic trading system designed to automatically identify these market swings. The yellow flags indicate the points where the algorithm detects potential trading opportunities.
During the bullish phase preceding the correction, the system executed five long trades:
This type of trade sequence is typical of quantitative momentum strategies. The objective is not to eliminate losses — an impossible goal in any trading strategy — but rather to maximize directional moves while limiting the impact of corrective phases.
The Value of Automation
One of the most important aspects of this approach is the absence of emotional bias. The algorithm applies predefined mathematical rules based on statistical models and risk management.
During periods of strong volatility such as the one observed between March 2 and March 3, this feature becomes particularly valuable. While discretionary traders may be influenced by fear or euphoria, the system continues to operate strictly according to its programmed parameters.
The result is a consistent, repeatable and disciplined decision-making process, where profitable trades tend to outweigh losing ones over time.
A Market That Remains Technically Interesting
Despite the decline recorded on March 3, gold’s broader market structure remains technically interesting. Recent price action confirms that the precious metal continues to be heavily influenced by geopolitical developments, speculative flows and hedging demand.
In such an environment, the combination of structural technical analysis and algorithmic trading tools can provide a significant advantage when navigating markets that are increasingly fast and complex.
The information contained in this article is provided for informational purposes only and does not constitute financial advice, investment recommendation, or solicitation to invest.
© 4FT Invest LTD. All rights reserved